Easy to digest environmental information
Backed up by raw data
There are about a billion passenger cars on the streets worldwide. This astonishing number of cars excludes over 300 million commercial vehicles. Today, about 55% of the world’s population lives in urban areas, a hefty increase from 30% in 1950. By 2050 we expect to have over 67% of humanity to live in cities. When we take into account the rapid growth of the global population we forecast over 6 billion people living in large cities by 2050.
Source: https://graylinegroup.com/urbanization-catalyst-overview/
As the population grows and our cities become denser, we cannot sustain the number of privately-owned passenger cars on the streets, otherwise, there will be no room left for living space. Space to walk, space for greenery, for parks for playgrounds, or for bicycles. The electrification of vehicles only gives an answer to the local pollution, but not for the “space problem”.
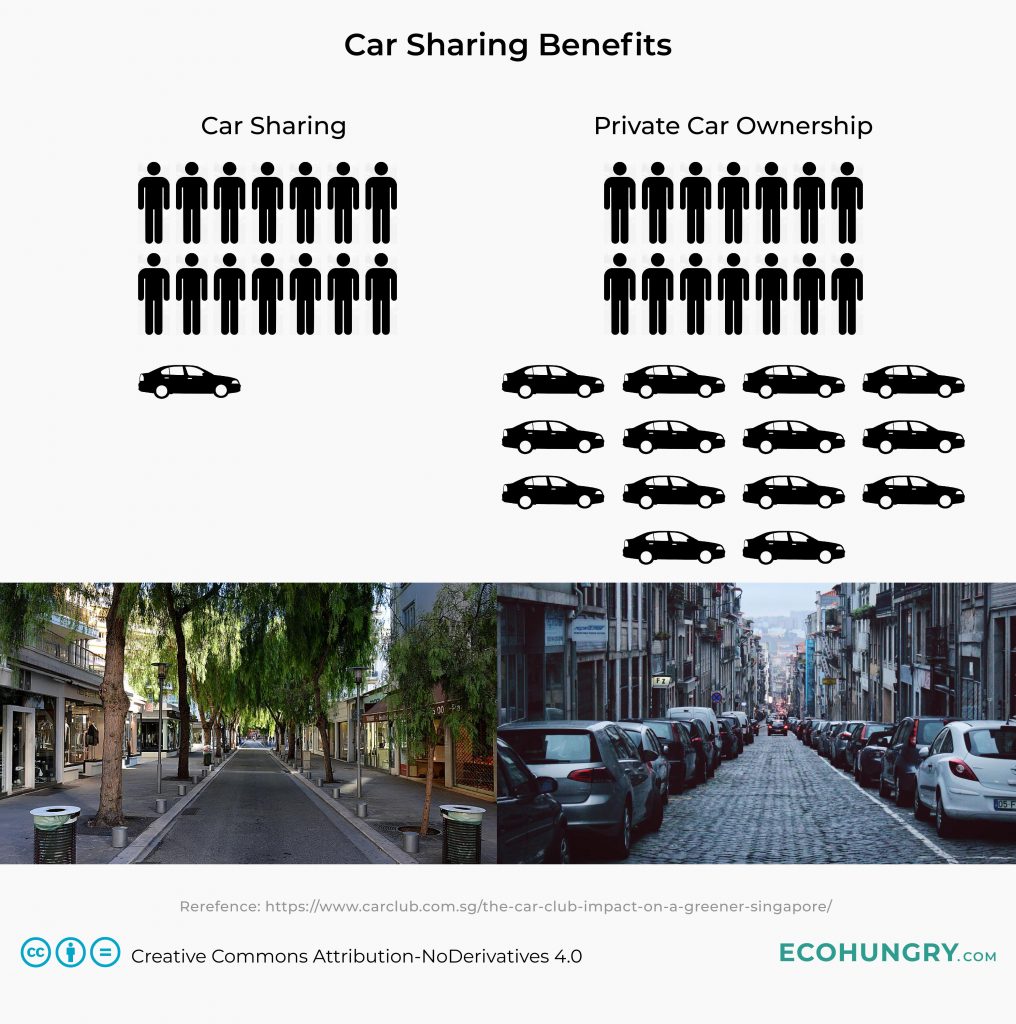
The obvious answer would be public transportation. It’s the most compact way to take people from A to B. However, no matter how advanced and well functioning public transportation is, passenger cars and commercial vehicles cannot be ignored. There is a way to make more space in the cities by eliminating most of the private vehicle ownership. On average a single shared car can replace 14 privately owned cars. This massive number would mean that over 9/10th of the space in our cities reserved for parking cars could find a new purpose. Future urban designing will need to find ways to create a new function for the freed areas.
Car Sharing Growth
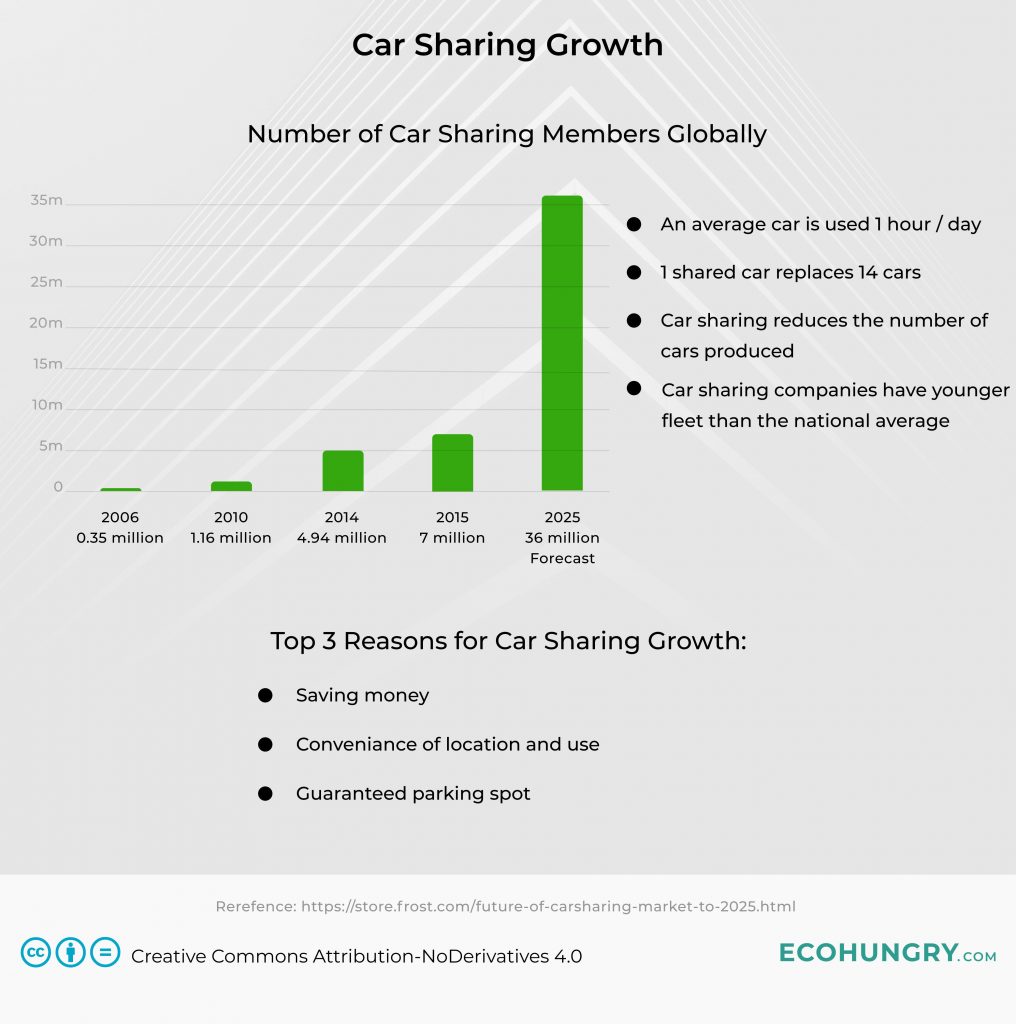
The annual membership growth of car-sharing companies sees exponential growth. In 2006 there were 350,000 users while by 2025 Frost & Sullivan expects 36 million registered members. This forecast is based on the rapid growth of car-sharing companies.
Deforestation in the Amazon until the mid 20th century was the result of farmers clearing the forest to make way for crops to feed their families and to sell them locally. Later as industrialized farming began to spread Amazon has seen the biggest annual loss of forest area from the 70s until today. By the mid-2000s cattle ranching was so profitable that three-quarter of the forest clearing was done to have space for cattle grazing and to grow crops to feed them. This trend is driven by large scale farming that seeks profits outside of the borders of Brazil. The country is now the biggest exporter of beef.
Source: http://www.gibbs-lab.com/recent-publications/
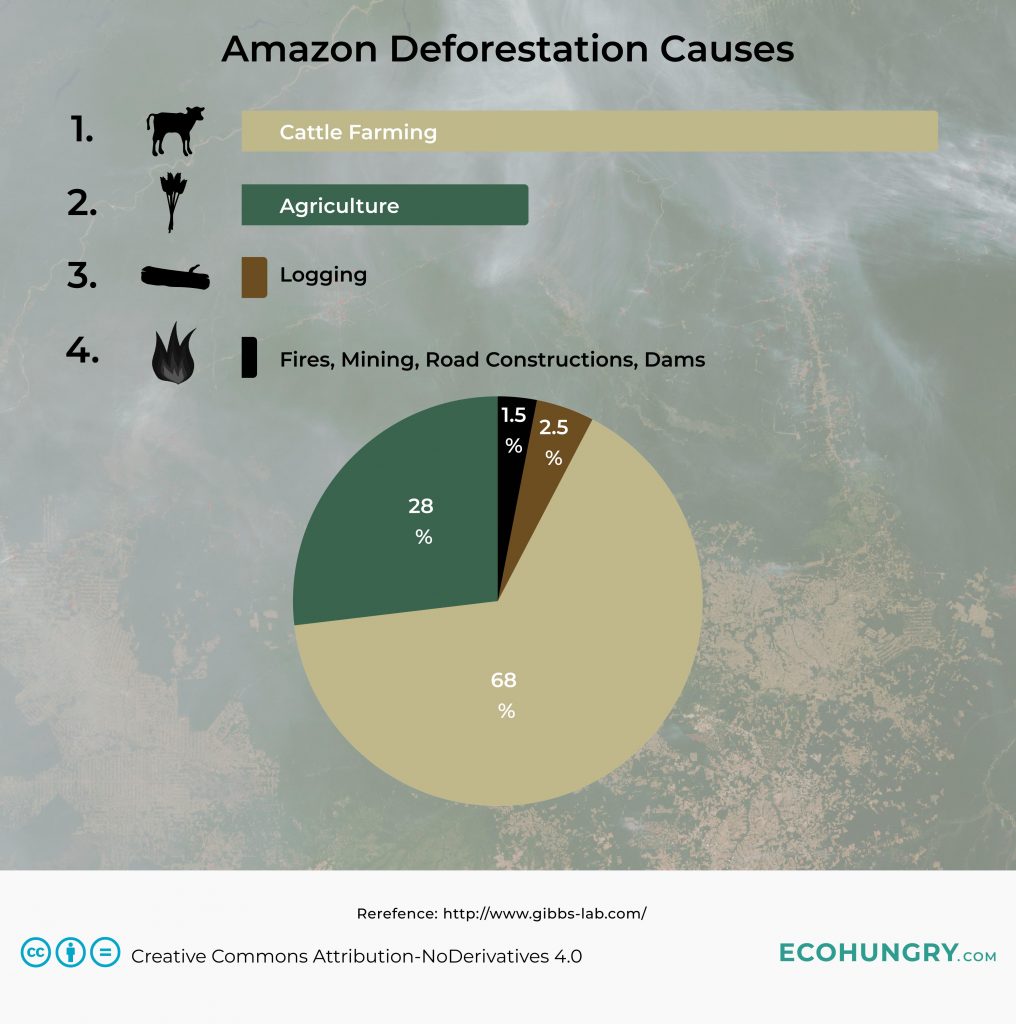
Brazil, The World’s Biggest Beef Exporter
Brazil had to clear vast amounts of the Amazon to make way for cattle farming and to become the largest beef exporter. The trend of deforestation continues as the surge for beef around the world is still increasing. Unless the trend changes it’s unlikely that the rapid deforestation in Amazon would stop.
The Top Beef Exporters in the World in 2018:
- 1. Brazil – 2,025,000 Tonnes / 19.33% share of the beef export in the world
- 2. India – 1,900,000 Tonnes / 18.14% share of the beef export in the world
- 3. Australia – 1,610,000 Tonnes / 15.37% share of the beef export in the world
- 4. United States – 1,372,000 Tonnes / 13.10% share of the beef export in the world
- 5. New Zealand – 560,000 Tonnes / 5.35% share of the beef export in the world
Source: FAS/USDA
The Secret of Soy Beans
Another large scale product of Brazil is soybean. This versatile plant is being used to create a vast amount of products. However, mostly it’s used to produce meat. In Europe, 93% of the soybean consumed is in the form of animal feed. Humanity could therefor use over 10 times more soybeans to create plant-based products or use the raw beans to feed people using the same amount of land as now. Soy is high in protein and energy, but it is currently being wasted to create inefficient meat-based products.
Source: Mapping the soy supply chain in Europe
Solution
Reduce meat consumption, especially beef as that requires the most land, water, energy and it is the number one reason for deforestation in the Amazon.
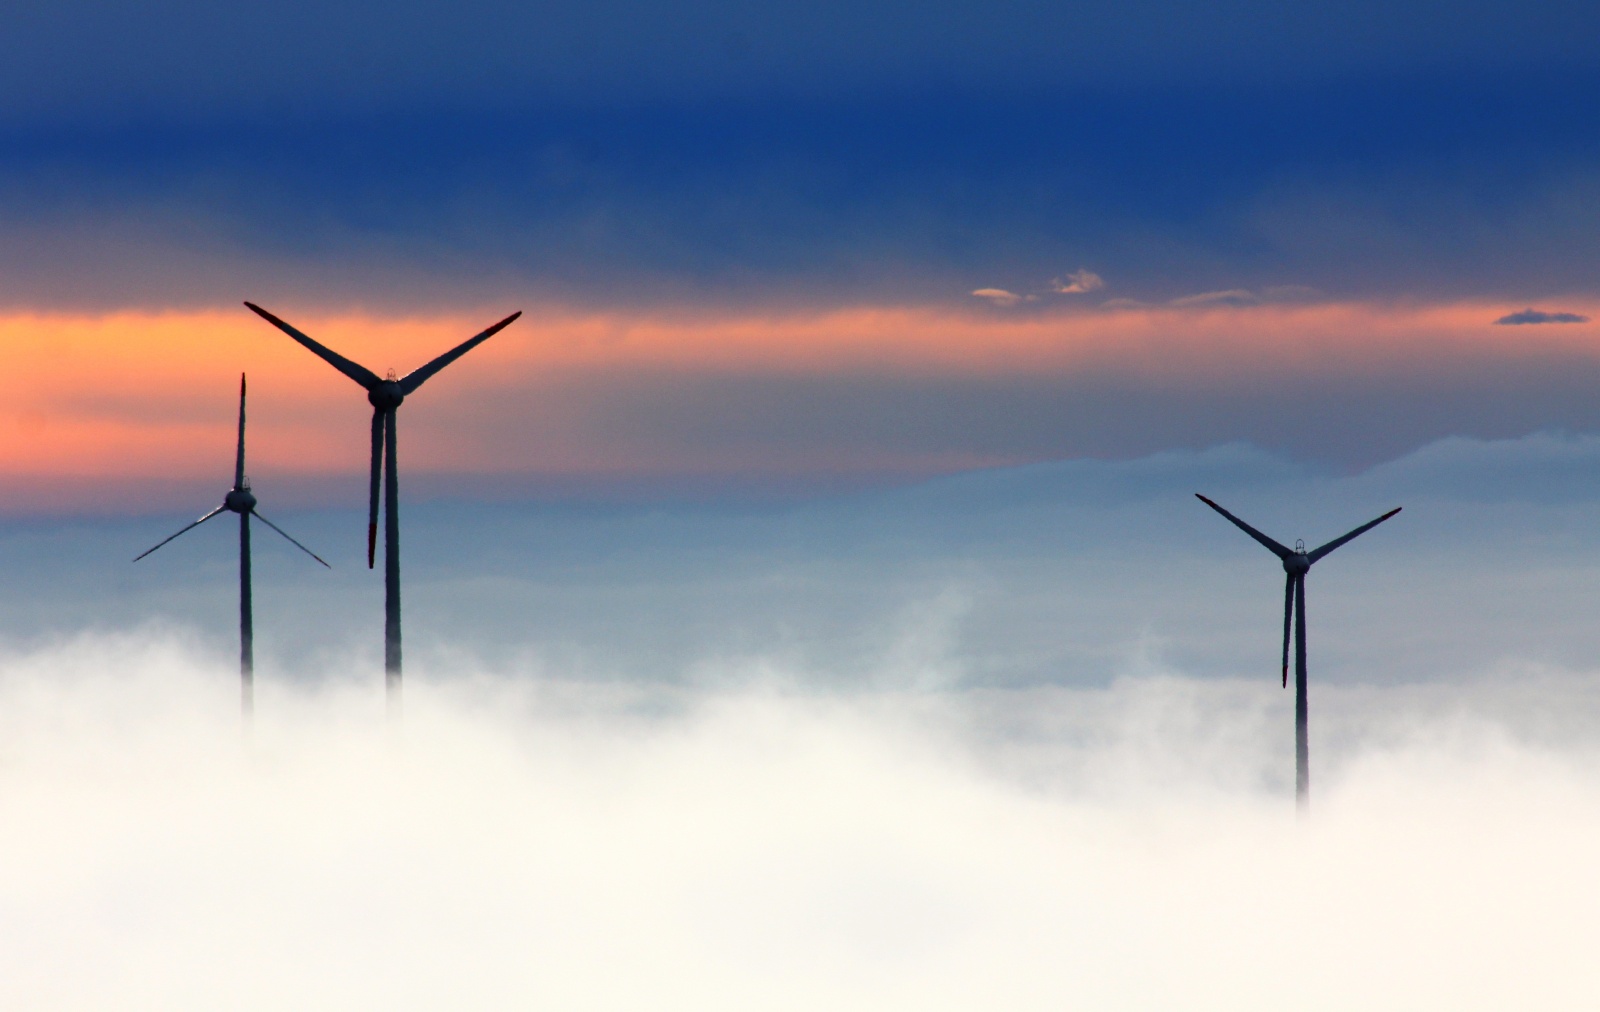
Worldwide there are over 200,000 wind turbines operating and the wind generation capacity doubles about every 3 years. Wind power is accounted for 9% of the global renewable energy consumption in 2017 and it has the second-fastest electricity generation growth after solar PV. Wind power has an important role in combating global warming. During its entire lifecycle, a modern wind power plant produces 41 times more energy than it consumes.
Source: https://www.iea.org/renewables2018/
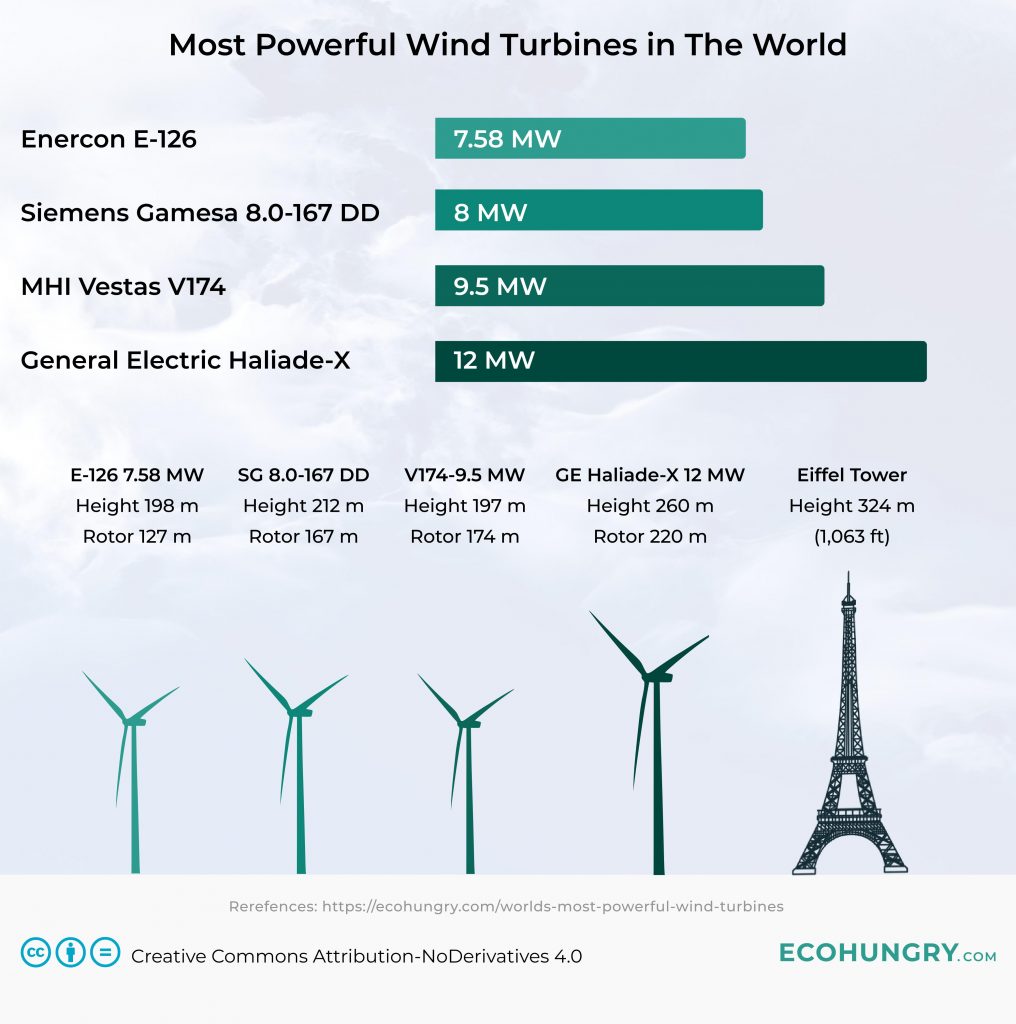
4. Enercon E-126 7.58 MW
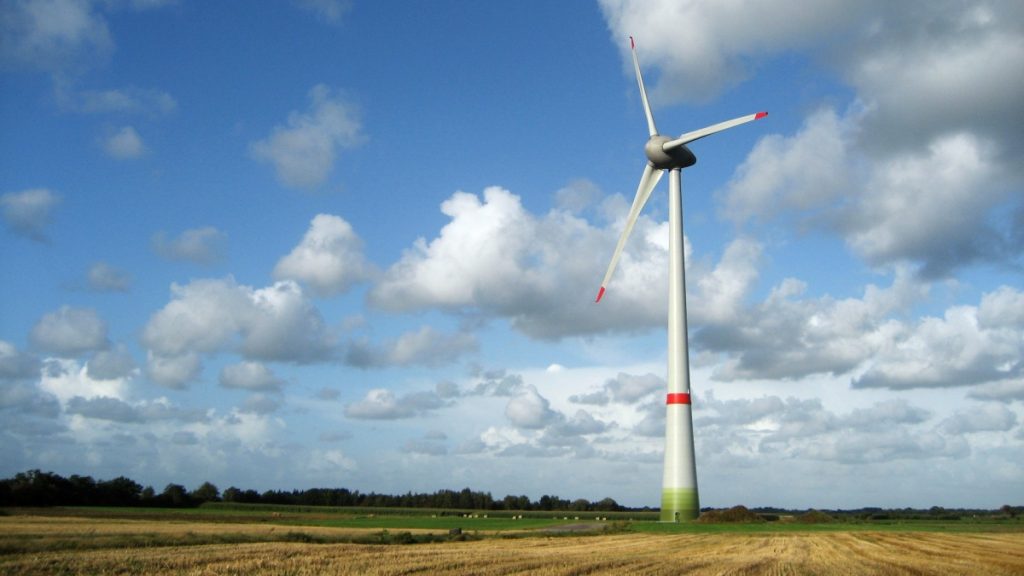
The E-126 is the world’s highest-performing onshore wind turbine manufactured by the German company Enercon. The 7.58MW model was introduced in 2011 and up until 2014, it was the largest wind turbine when the Danish company, Vestas, came out with its V164-8.0 model. The total weight of this massive turbine is 6,012 tonnes.
Rated power: 7.580 kW
Rotor diameter: 127 m
Hub height: 135 m
Total height: 198 m
Source: https://www.enercon.de/en/products/ep-8/e-126/
3. Siemens Gamesa 8.0-167 DD
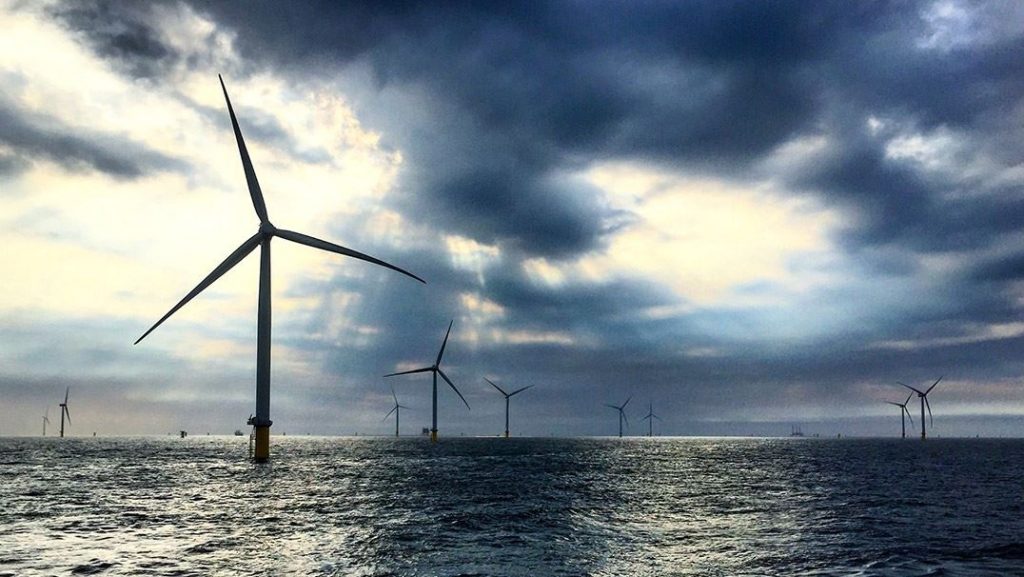
A larger rotor installed with the new 81.5 meter long aerodynamic blades results in 20% more energy produced annually compared to the predecessor. Simplified production means there will be 1,000 SG 8.0-167 DD offshore wind turbines produced by the beginning of 2020. A more powerful model is in the pipeline as well, the SG 10.0-193 DD with 10 MW power in 2022.
Source: https://www.siemensgamesa.com/en-int/products-and-services/offshore/wind-turbine-sg-8-0-167-dd
2. MHI Vestas V174
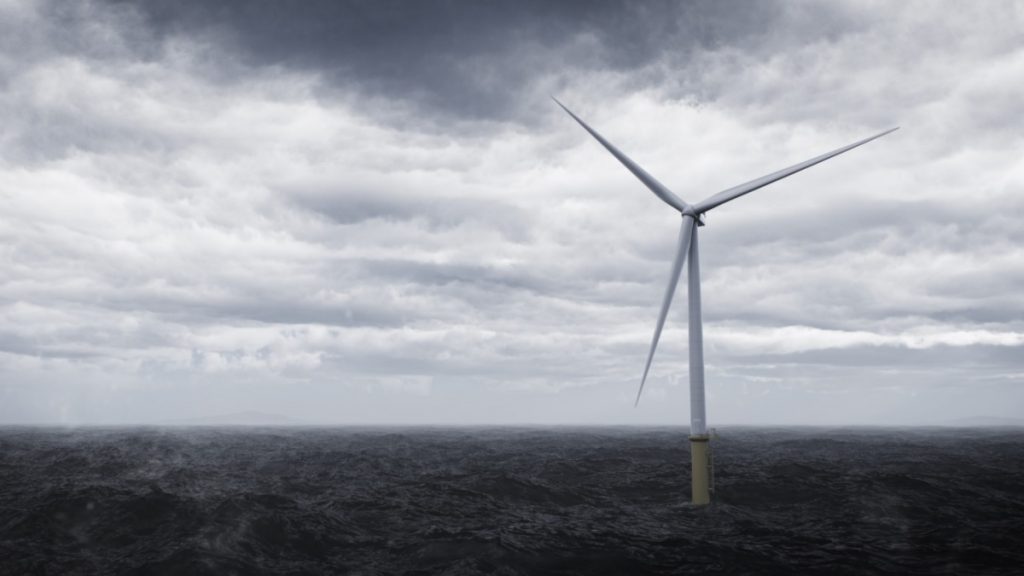
Vestas has taken the proven 9.0 MW platform and upgraded it to 9.5 MW. It currently has the largest commercially proven rotor size – 174 meters. Each of the blades on this offshore wind turbine weighs 35 tonnes. The swept area of 23,779 m2 is more than double the area of the London Eye. A single turbine can power up to 9,000 average homes in the United Kingdom.
Source: http://www.mhivestasoffshore.com/innovations/
1. GE Haliade-X 12 MW
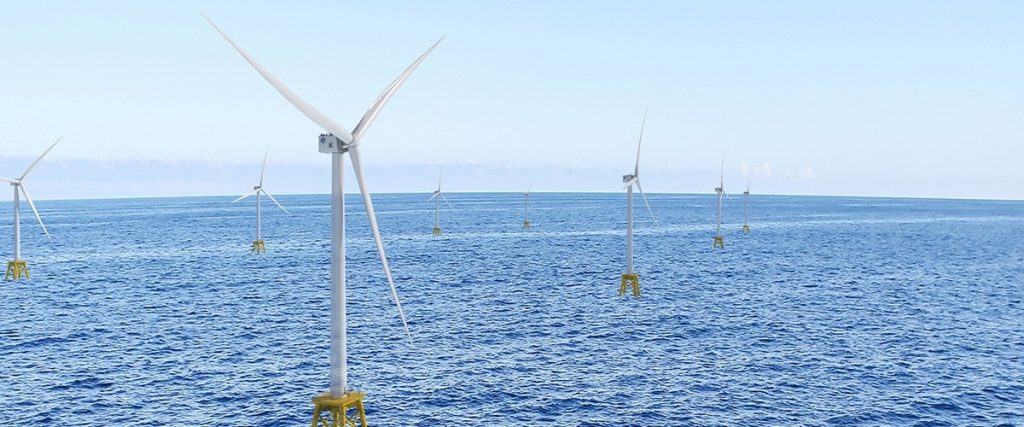
GE Renewable Energy has introduced the world’s largest and most powerful wind turbine, the Haliade-X. It produces 12 MW power, has a 220-meter rotor, and a 107-meter blade designed by LM Wind Power. It’s also claimed to be the most efficient offshore wind turbine to date. It can generate up to 67 GWh annually, which can power 16,000 average European homes. 63 of these giants would be enough to give energy to a million homes.
While all these numbers are impressive, currently this model is being tested in the Netherlands and commercial use is supposed to begin in 2021.
Source: https://www.ge.com/renewableenergy/wind-energy/offshore-wind/haliade-x-offshore-turbine
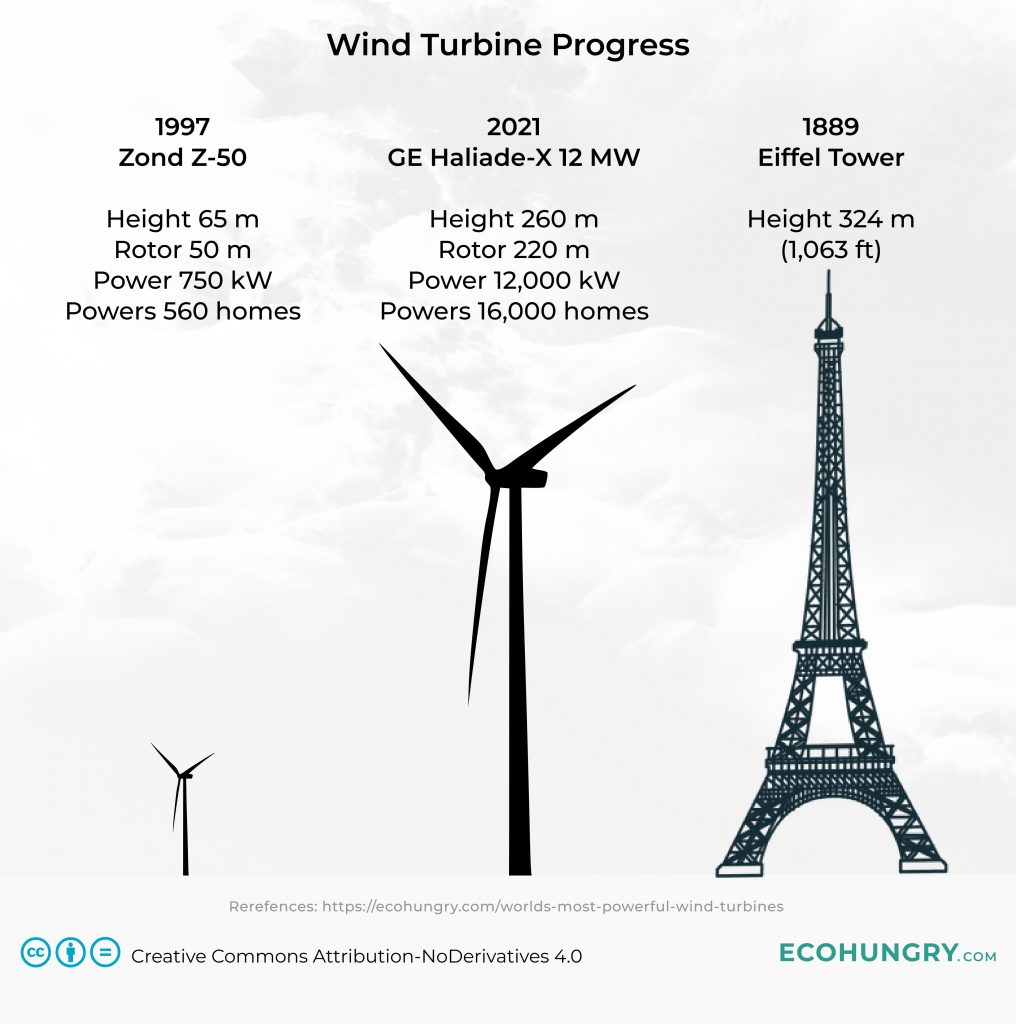
Wind Turbines are 50 times more powerful than 20 years ago
The average rated output of a wind turbine in 1990 was just 50 kW. In 2016 the same number was 2848 kW. The most powerful wind turbine, the GE Haliade-X, starts operating in 2021 and it is rated at 12,000 kW. That’s a staggering 240 times more power than an average wind turbine in 1990.
Source: https://en.wikipedia.org/wiki/File:Growing_size_of_wind_turbines.png
Electric cars are known to be very efficient when it comes to fuel consumption, but how much exactly? We compare the best selling new petrol cars on the market with the most popular electric vehicles that you can buy now in the USA. Which one you should consider and why? We take a look at the numbers in depth.
Source: https://www.fueleconomy.gov/
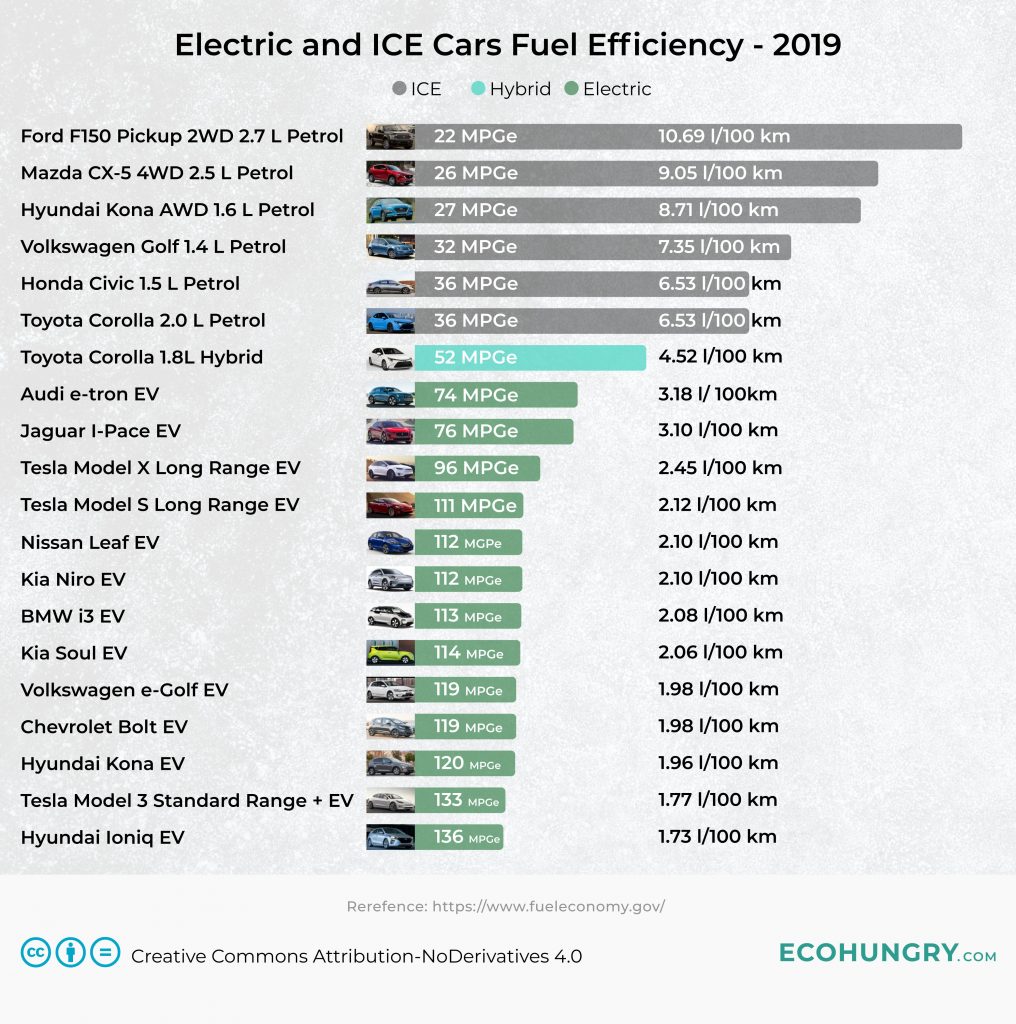
Ford F-150 is the best selling car in the USA. There were 909,330 units sold last year of this model. We compare the standard model with the 2.7 Liter engine and 2 wheel drive to other SUV’s and sedan cars to see how far a single gallon takes you with these vehicles.
MPGe stands for Miles per gallon gasoline equivalent to be able to compare ICE (Internal Combustion Engine), hybrid and fully electric cars. An interesting fact to add to the list is the EV1 car that was produced in small numbers in the late ’90s by General Motors had a record high 205 MPGe. No mass-produced car has come close to this figure to this date.
The Full List
- Ford F150 Pickup 2WD 2.7 L - 22 MPGe (10.69 l/100 km) or 0.65 mi/kWh (1.00 km/kWh)
- Mazda CX-5 4WD 2.5 L - 26 MPGe (9.05 l/100 km) or 0.77 mi/kWh (1.20 km/kWh)
- Hyundai Kona AWD 1.6 - 27 MPGe (8.71 l/100 km) or 0.80 mi/kWh (1.29 km/kWh)
- Volkswagen Golf 1.4 L - 32 MPGe (7.35 l/100 km) or 0.95 mi/kWh (1.50 km/kWh)
- Honda Civic 1.5 L - 36 MPGe (7.35 l/100 km) or 1.07 mi/kWh (1.72 km/kWh)
- Toyota Corolla 2.0L - 36 MPGe (7.35 l/100 km) or 1.07 mi/kWh (1.72 km/kWh)
- Toyota Corolla 1.8L Hybrid - 52 MPGe (4.52 l/100 km) or 1.54 mi/kWh (2.50 km / kWh)
- Audi E-tron - 74 MPGe (3.18 l/ 100km) or 2.20 mi/kWh (3.54 km/kWh)
- Jaguar I-Pace - 76 MPGe (3.10 l/100 km) or 2.26 mi/kWh (3.64 km/kWh)
- Tesla Model X Long Range - 96 MPGe (2.45 l/100 km) or 2.85 mi/kWh (4.59 km/kWh)
- Tesla Model S Long Range - 111 MPGe (2.12 l/100 km) or 3.29 mi/kWh (5.29 km/kWh)
- Nissan Leaf - 112 MGPe (2.10 l/100 km) or 3.32 mi/kWh (5.34 km/kWh)
- Kia Niro - 112 MPGe (2.10 l/100 km) or 3.32 mi/kWh (5.34 km/kWh)
- BMW i3 - 113 MPGe (2.08 l/100 km) or 3.35 mi/kWh (5.39 km/kWh)
- Kia Soul - 114 MPGe (2.06 l/100 km) or 3.38 mi/kWh (5.44 km/kWh)
- Volkswagen e-Golf - 119 MPGe (1.98 l/100 km) or 3.53 mi/kWh (km/kWh)
- Chevrolet Bolt EV - 119 MPGe (1.98 l/100 km) or 3.53 mi/kWh (km/kWh)
- Hyundai Kona - 120 MPGe (1.96 l/100 km) or 3.56 mi/kWh (km/kWh)
- Tesla Model 3 Standard Range Plus - 133 MPGe (1.77 l/100 km) or 3.95 mi/kWh (6.36 km/kWh)
- Hyundai Ioniq - 136 MPGe (1.73 l/100 km) or 4.04 mi/kWh (6.50 km/kWh)
* 1 gallon of gasoline = 33.7 kWh
Petrol, Hybrid or Electric?
Strictly from an energy efficiency point of view, the answer is simple. Electric is always vastly more efficient and it will take you further on the same amount of energy. As an example, Hyundai produces petrol as well as a full-electric version of the Kona. When we compare the two, we see that the EV is 4.44 times more efficient than its petrol-powered counterpart.
We have also established in another article that electric vehicles are less polluting even if the energy production of the country mainly comes from coal-burning.
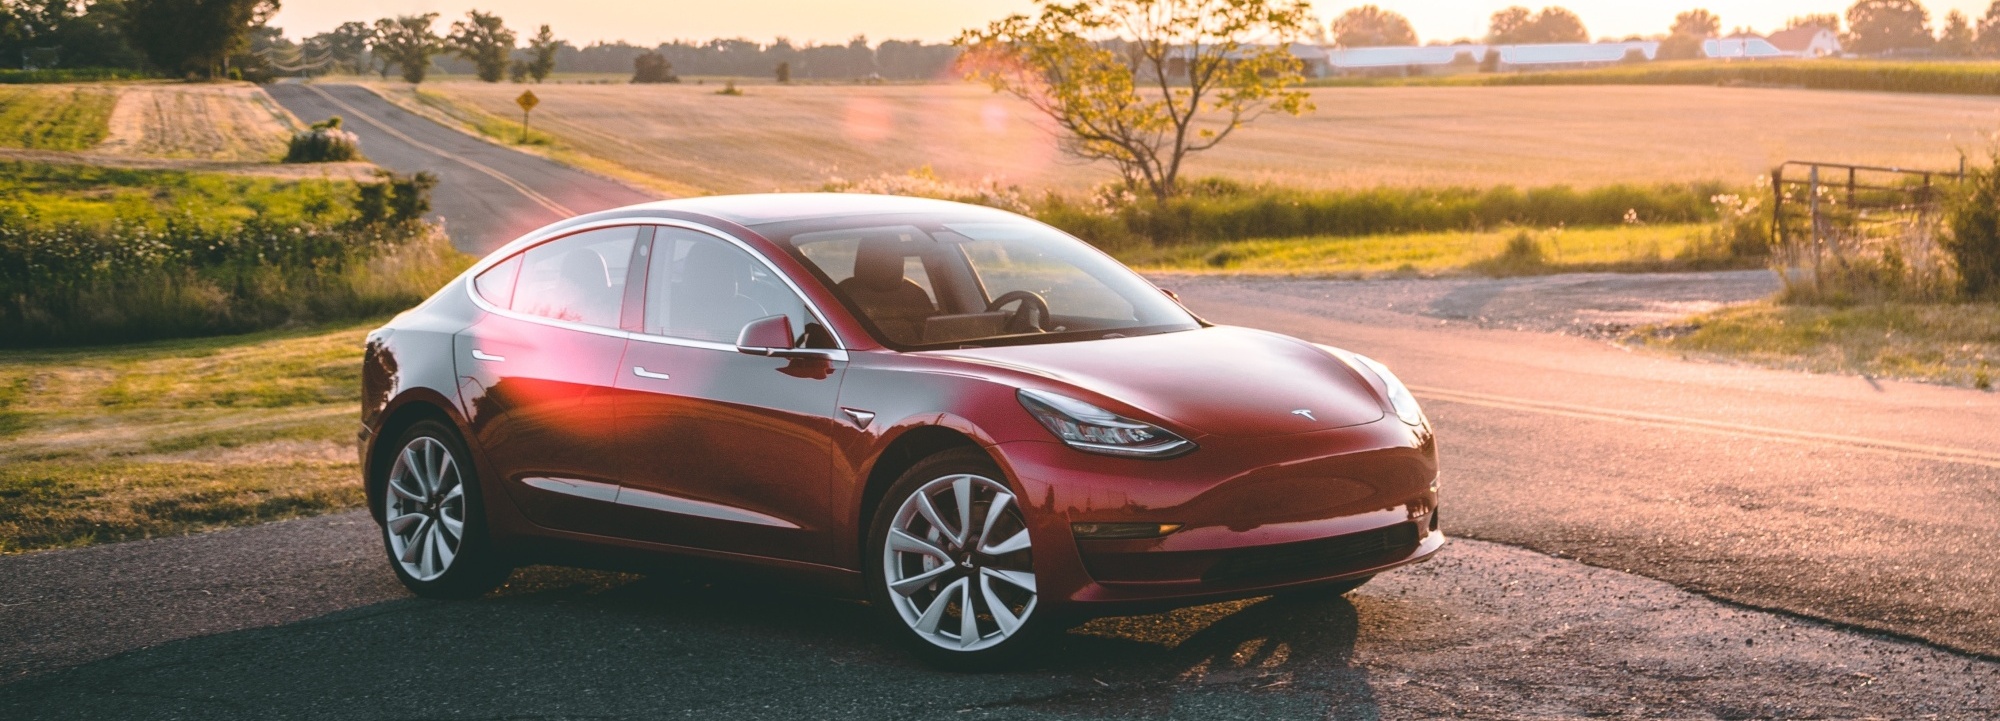
What about the range? Modern electric cars such as the Tesla Model 3 have a range of over 300 miles. The latest V3 rapid chargers of the company are able to charge at a rate of 75 miles in just 5 minutes (250kW charging). As the technology further progresses we can expect more range and quicker charging times.
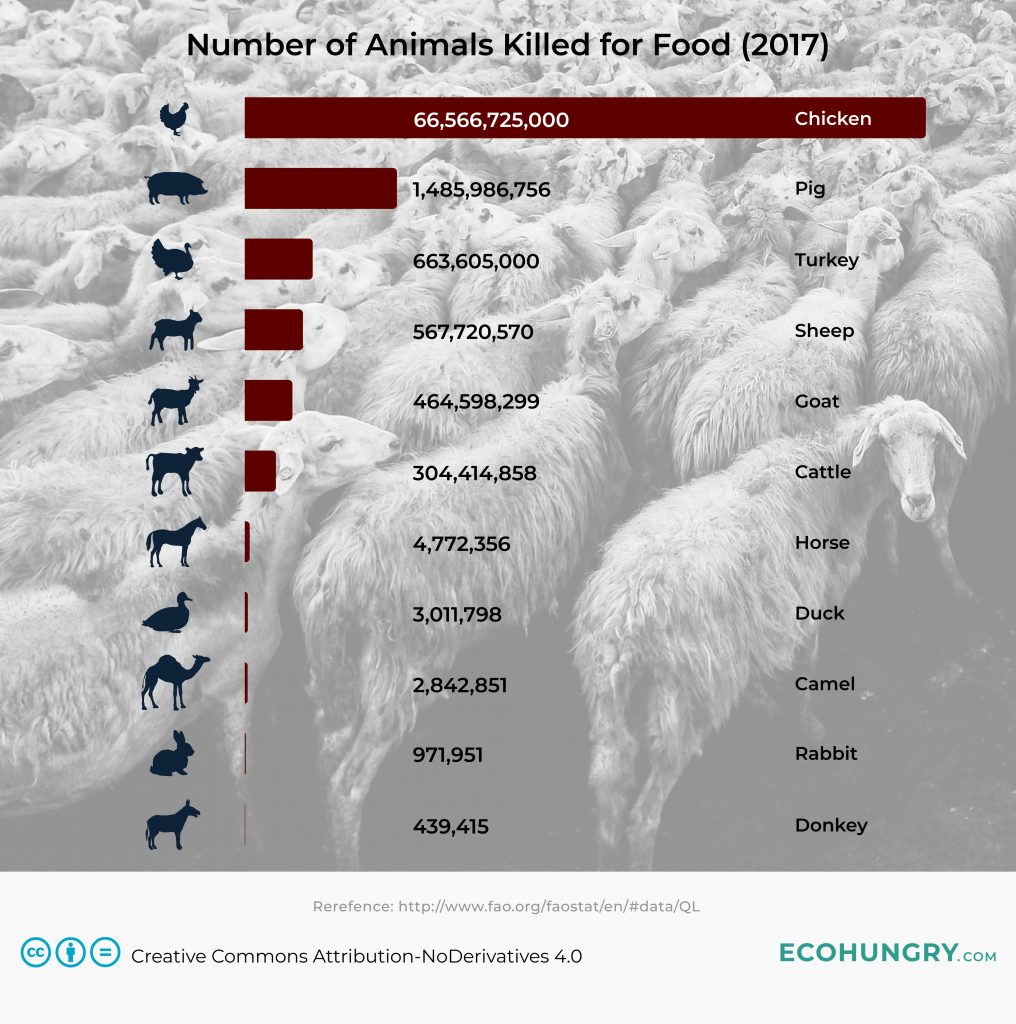
In this article, we visualize the number of domesticated animals that we kill annually for their meat. The data is from 2017 and it does not include the number of animals killed for their skin or by indigenous people.
The numbers are staggering. In the year of 2017 alone, over 66 billion chickens were killed, that’s about 8.6 times the whole human population. Less known fact that there are nearly 3 million camels killed annually for food as well.
Reference: http://www.fao.org/faostat/en/#data/QL
Meat consumption has been steadily growing in the past century. Since the 1960’s humans eat nearly double the amount. 24.2 kg of meat/person in 1964 and all the way to 41.3 kg in 2015. Additionally, the world population has more than doubled since adding to the size of the meat industry and the number of animals we kill to sustain the growth in demand.
Source: http://www.fao.org/3/Y4252E/y4252e05b.htm
Why is this Important?
1. Land Requirements of Livestock
Domesticated animals require vast lands. 26 percent of the Planet’s ice-free land is used for livestock grazing while 33 percent of croplands generate food to feed them. That’s a total of 59% land without ice that’s needed to produce meat. Nature and humans remain with 41% and due to the increase in farmlands, this number shrinks every year. We lose 13 billion hectares of forest each year because of this.
According to Global Environmental Change Volume 47, a shift towards a plant-based diet would result in a 64% reduction in land use, and a 73% reduction in GHG emissions.
Source: http://www.fao.org/3/ar591e/ar591e.pdf
https://www.sciencedirect.com/science/article/pii/S0959378016306872
2. Water Consumption of Livestock
A cow drinks an average of 32 liters (8.5 gallons) of freshwater a day (at an average of 15.5 Celsius (60 Fahrenheit). Multiplied by the number that is killed annually that’s 9,741,275,456 liters (2,573,372,730 gallons) of daily water consumption of the cows alone (not counting the dairy cows which have a much higher need of water, nor any other species).
Source: http://extensionpublications.unl.edu/assets/html/g2060/build/g2060.htm
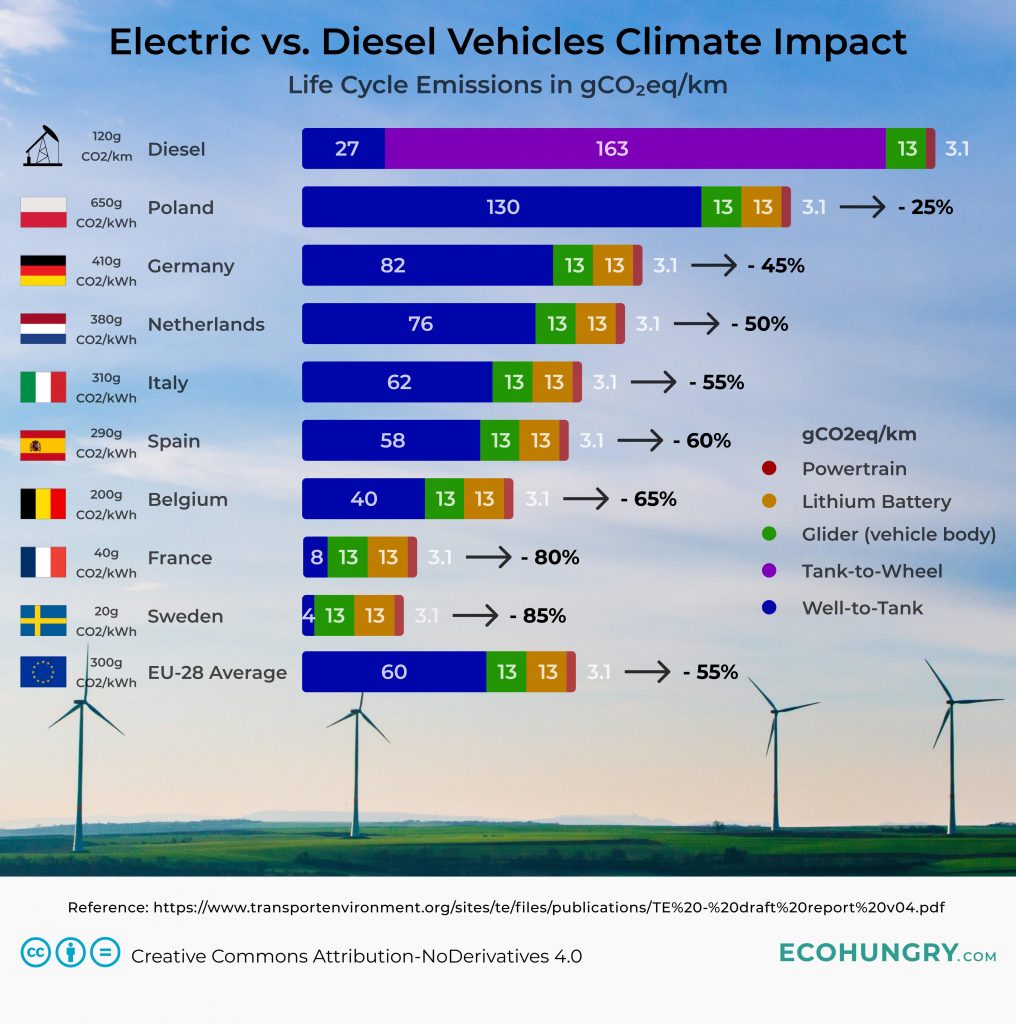
We take a look at the full life cycle of electric vehicles climate impact (CO₂ emissions) in different countries in the European Union to compare them with diesel vehicles. EU state member countries have largely different supply mix of electricity, which directly influences the BEV’s (Battery Electric Vehicles) carbon footprint. A common theory surrounding electric vehicles is if the source of energy is mainly from coal burning power plants then they are creating more greenhouse gases than diesel or petrol cars. We can see from this research that it’s not the case, not even in Poland which is the worst offender when it comes to dirty energy generation in the EU.
Reference: https://www.transportenvironment.org/sites/te/files/publications/TE%20-%20draft%20report%20v04.pdf
What is a Life Cycle?
We count all environmentally significant processes throughout the life cycle of vehicles
- Raw material extraction
- Production of parts
- Assembly
- Transport
- Vehicle use (including fueling)
- End-of-life treatment
Data
- The units ‘gCO₂eq/kWh’ are grams of carbon dioxide equivalent per kilowatt-hour of electricity generated
- Life time driven distance of 200,000km
- Glider (vehicle body without the powertrain) weight is 1200kg
- Electric car has a 30kWh LMO battery and 20 kWh/100km real-life energy consumption. 1,5 battery replacement is calculated during this 200,000km period.
- Diesel car emits 120 gCO₂/km on NEDC which translates to 162 gCO₂/km real-life emission.
Are Electric Vehicles Cleaner Than Diesel Vehicles?
Electric vehicles are cleaner even in the least eco-friendly country in Europe. The current EU average of carbon footprint is 300 gCO₂/kWh, which is expected to drop significantly to 200 gCO₂/kWh in 2030 and 80 gCO₂/kWh in 2050. This means that electric vehicles will get cleaner by time and they are already the greener alternative to vehicles with ICE (Internal Combustion Engine).
The aviation industry is growing each year and it is expected to have double the number of passengers within 20 years. We have multiple choices of airlines to select from and this could directly influence how much kerosene is discharged in the air. Therefore increasing or decreasing the greenhouse gases in the atmosphere. We take a look at the best, the largest and the worst airline in the world.
Ranking of Greenest Airlines in the World
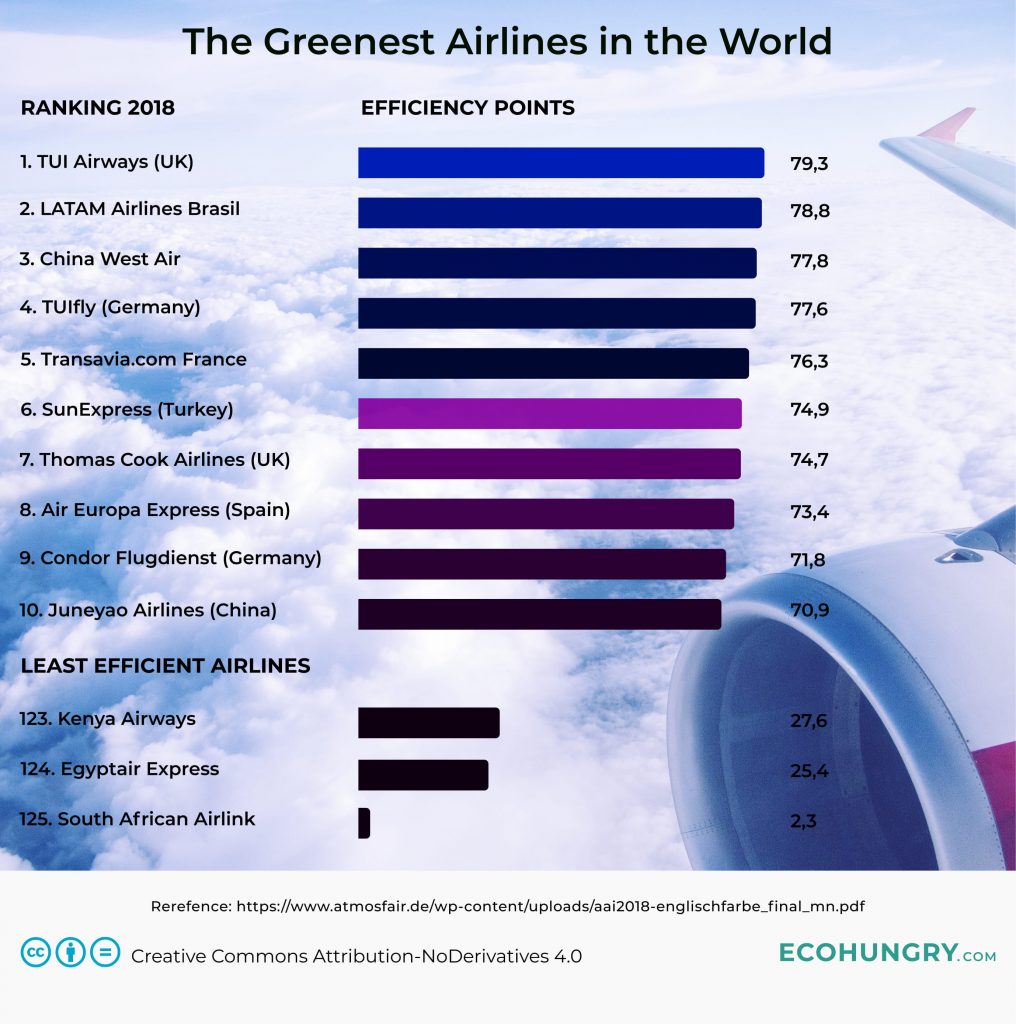
Ranking of the Largest Airlines in the World Based on Efficiency

Sources: https://www.atmosfair.de/wp-content/uploads/aai2018-englischfarbe_final_mn.pdf
https://www.iata.org/publications/store/Documents/WATS-toc.pdf
Which airline to fly with?
The obvious answer would be the more efficient on the list the better it is. However, there is a factor that is more important in most cases. Which one has the least amount of changes? The more direct the flight, the fewer changes, the fewer emissions. The combination of the most efficient airline with the least amount of changes gives the greenest option.
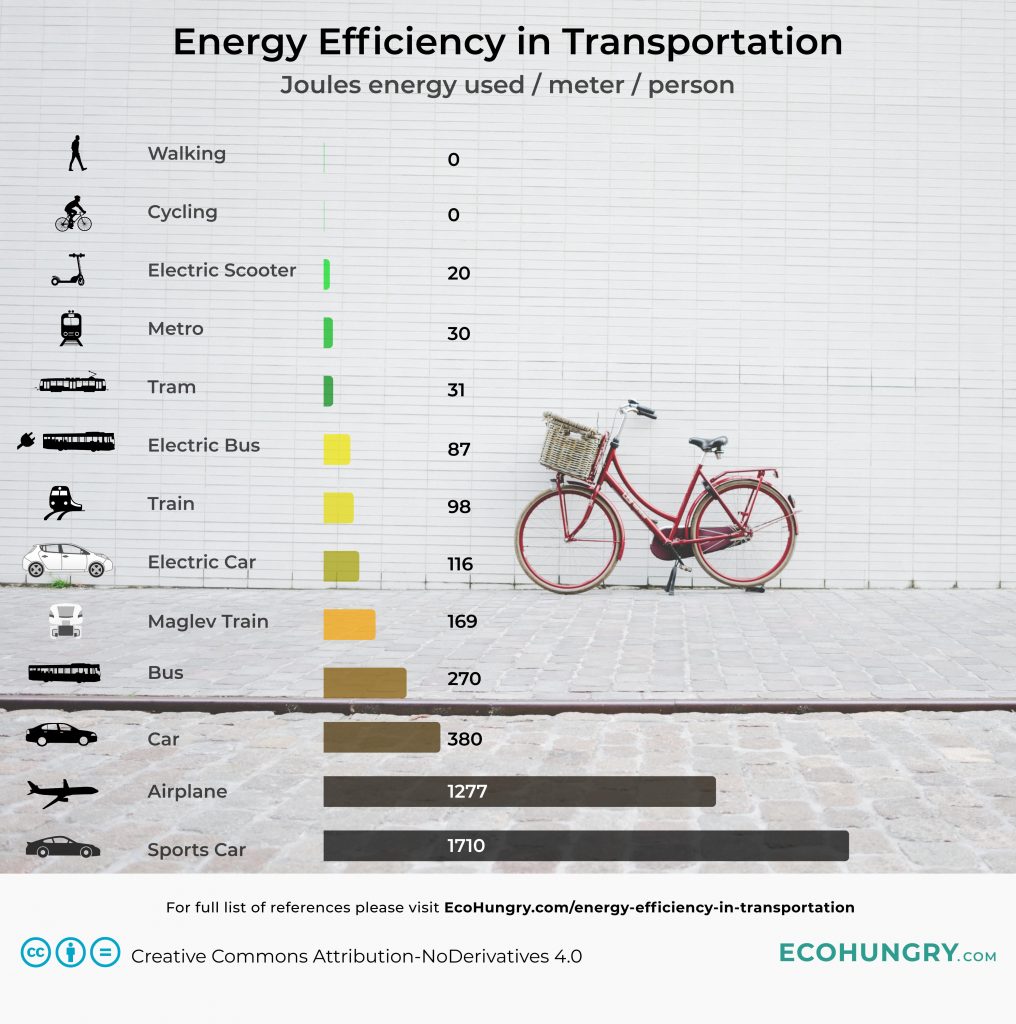
Different means of transportation range in energy consumption
substantially. Firstly, this set of data needs careful examination as the use of power depends on a wide variety of factors. Secondly, in our case we take an ideal circumstance for public and private transportation where cars are occupied by the maximum number of allowed people and metro, tram, trains, buses, and airplanes operate at their peak capacity. As a result, this shows an upper limit of the efficiency of these transportation modes.
Efficiency based on occupancy
When the occupancy rate drops of the different transportation modes, the efficiency changes dramatically. For instance, a car with seats for 5 passengers will become 5 times less efficient from the moment it’s solely occupied by the driver. Airplane efficiency can drop to half of the plane is only 50% full, and the same can be said for trams, trains, or buses.
Energy used for production
Another factor to take into consideration is the energy that is used to create the transportation vehicle that will move people from A to B. This is not incorporated in the infographic shown above, however, it’s an important aspect. Walking does not involve any vehicle, while the power required to produce an airplane compared to a bicycle is exponentially bigger - just think of a 10 kg (22 lbs) bike and an 80,000 kg (175,000 lbs) aircraft.
You are what you eat
Your choice of food also determines how big your ecological footprint is, hence how much pollution the calories you intake produce. The food you choose has a substantial impact on harmful emissions. This means the better food you eat, the less pollution you cause by walking or riding a bicycle.
In this infographic, we do not take into account the food needed to fuel each vehicle as that would make it incoherent.
Which transportation mode to choose to reduce your carbon footprint?
The occupancy rates are not always ideal in the real world, as well as the energy spent on production varies greatly. Walking, cycling, skating, and other human-powered means of transportation are the most environmentally friendly. The best is to walk as that doesn’t even require the manufacturing of a vehicle.
In urban environments choose electrified means of transportation: metro, tram, or electrified buses. Long-distance traveling is the most eco-friendly on trains. Try to avoid driving a car alone and flying.
References:
- Electric Scooter
An electric scooter going at 18 km/h https://blossoms.mit.edu/sites/default/files/video/download/Scooter.pdf - Metro
Bombardier T-1 Subway at peak capacity with 315 passengers
http://adl.stanford.edu/aa260/Lecture_Notes_files/transport_fuel_consumption.pdf - Tram
Siemens Combino at peak capacity with 180 passengers
http://adl.stanford.edu/aa260/Lecture_Notes_files/transport_fuel_consumption.pdf - Electric Bus
BYD K9 fully electric bus at peak capacity with 58 passengers. It has a 1.41 kWh/km average energy consumption (annual average) in heavy city traffic
https://www.nordicenergy.org/wp-content/uploads/2018/02/3.-Test-of-large-charged-electric-buses-in-Copenhagen-Victor-Hug.pdf - Train
TGV Atlantique train, 220 km/h max speed at peak capacity with 485 passengers
http://adl.stanford.edu/aa260/Lecture_Notes_files/transport_fuel_consumption.pdf - Cycling
64 kg person biking at 15 km/hr speed on a 10 kg bicycle: http://www.tribology-abc.com/calculators/cycling.htm - Electric Car
Tesla Model 3 Long Range, riding with 5 occupants
https://www.fueleconomy.gov/feg/PowerSearch.do?action=noform&path=1&year1=2018&year2=2018&make=Tesla&baseModel=Model%203&srchtyp=ymm - Maglev Train
Transrapid train in Shanghai riding at speeds of 300km/h at peak capacity with 440 passengers
http://adl.stanford.edu/aa260/Lecture_Notes_files/transport_fuel_consumption.pdf - Walking:
64 kg person walking at an average speed of 5.63 km/h https://www.ncbi.nlm.nih.gov/pubmed/15570150 - Bus
Diesel bus operating in Vancouver, Canada, at peak capacity with 90 passengers on board
http://adl.stanford.edu/aa260/Lecture_Notes_files/transport_fuel_consumption.pdf - Car
VW Golf 1.9 Diesel Automatic, with 5 occupants inside the car
http://adl.stanford.edu/aa260/Lecture_Notes_files/transport_fuel_consumption.pdf - Airplane
Boeing 737, peak capacity (JetBlue Airline at 83.2% load factor) with 137 passengers on board - Sports Car
Porsche Boxster S (3.2L, 5 speed Tiptronic) with 2 occupants
http://adl.stanford.edu/aa260/Lecture_Notes_files/transport_fuel_consumption.pdf


